

To insert a chart:
Place the insertion point where you want the chart to appear.
Navigate to the Insert tab, then click the Chart command in the Illustrations group.
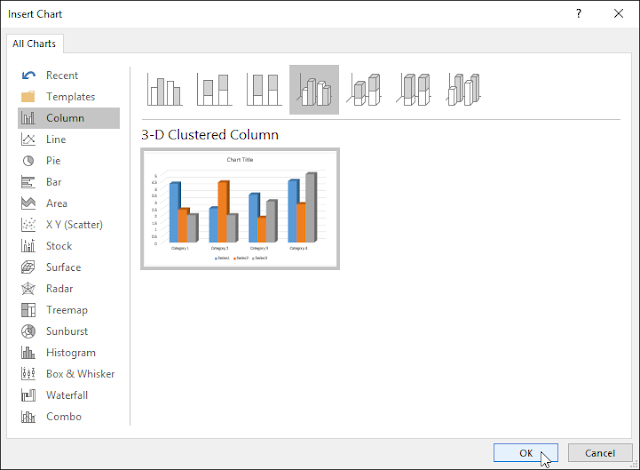
A dialog box will appear. To view your options, choose a chart type from the left pane, then browse the charts on the right.
Select the desired chart, then click OK.
A chart and spreadsheet window will appear. The text in the spreadsheet is merely a placeholder that you'll need to replace with your own source data. The source data is what Word will use to create the chart.
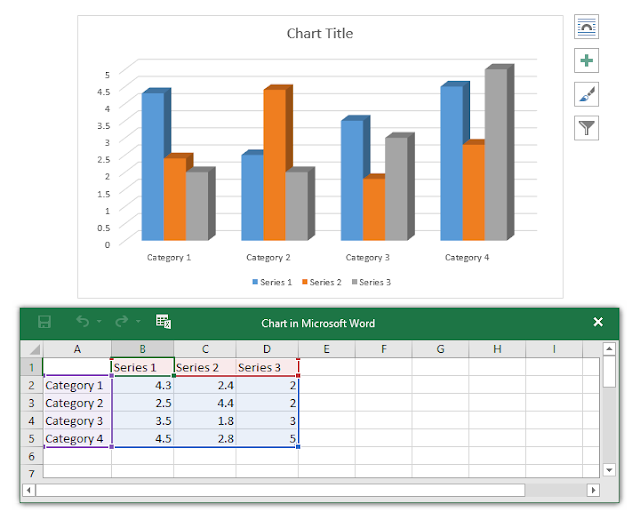
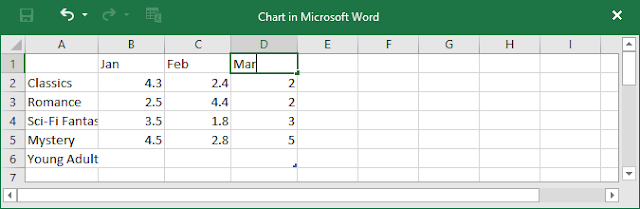
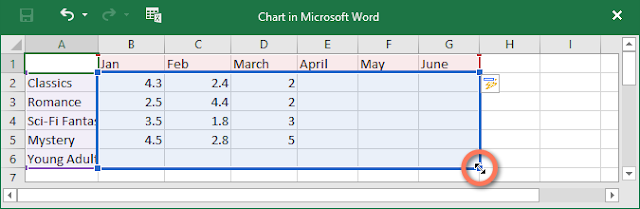
Enter your source data into the spreadsheet.
Only the data enclosed in the blue box will appear in the chart. If necessary, click and drag the lower-right corner of the blue box to manually increase or decrease the data range.
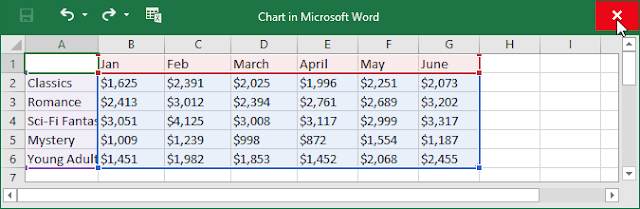
When you're done, click X to close the spreadsheet window.
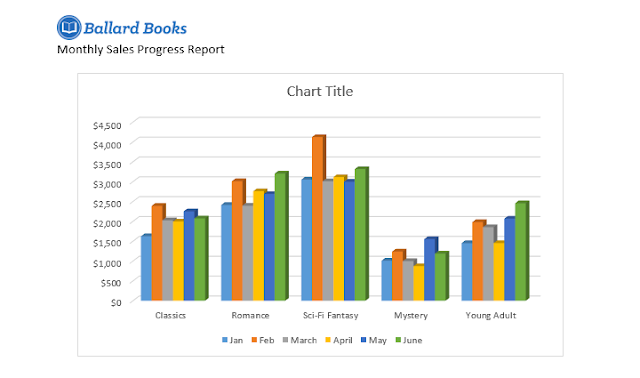
The chart will be complete.
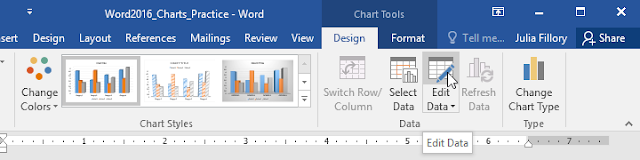
To edit your chart again, simply select it, then click the Edit Data command on the Design tab. The spreadsheet window will reappear.
Creating charts with existing Excel data
If you already have data in an existing Excel file that you'd like to use in Word, you can copy and paste it instead of entering it by hand. Just open the spreadsheet in Excel, copy the data, then paste it as the source data in Word.
You can also embed an existing Excel chart into your Word document. This is useful if you know you're going to be updating your Excel file later; the chart in Word will update automatically any time a change is made.